# How To Monitor Pod Resource Using Grafana
1. Log in to Grafana url with credentials \
To Get Grafana credentials: \
Username:
```shell
kubectl get secret monitoring-monitoring-grafana -o jsonpath='{.data.admin-user}' | base64 -d
```
Password:
```shell
kubectl get secret monitoring-monitoring-grafana -o jsonpath='{.data.admin-password}' | base64 -d
```
Or [review password value within helm chart](https://repo1.dso.mil/platform-one/big-bang/apps/core/monitoring/-/blob/main/chart/values.yaml#L708)
1. Once logged in and directed to the home page, click the menu Dashboard and then select Manage. \
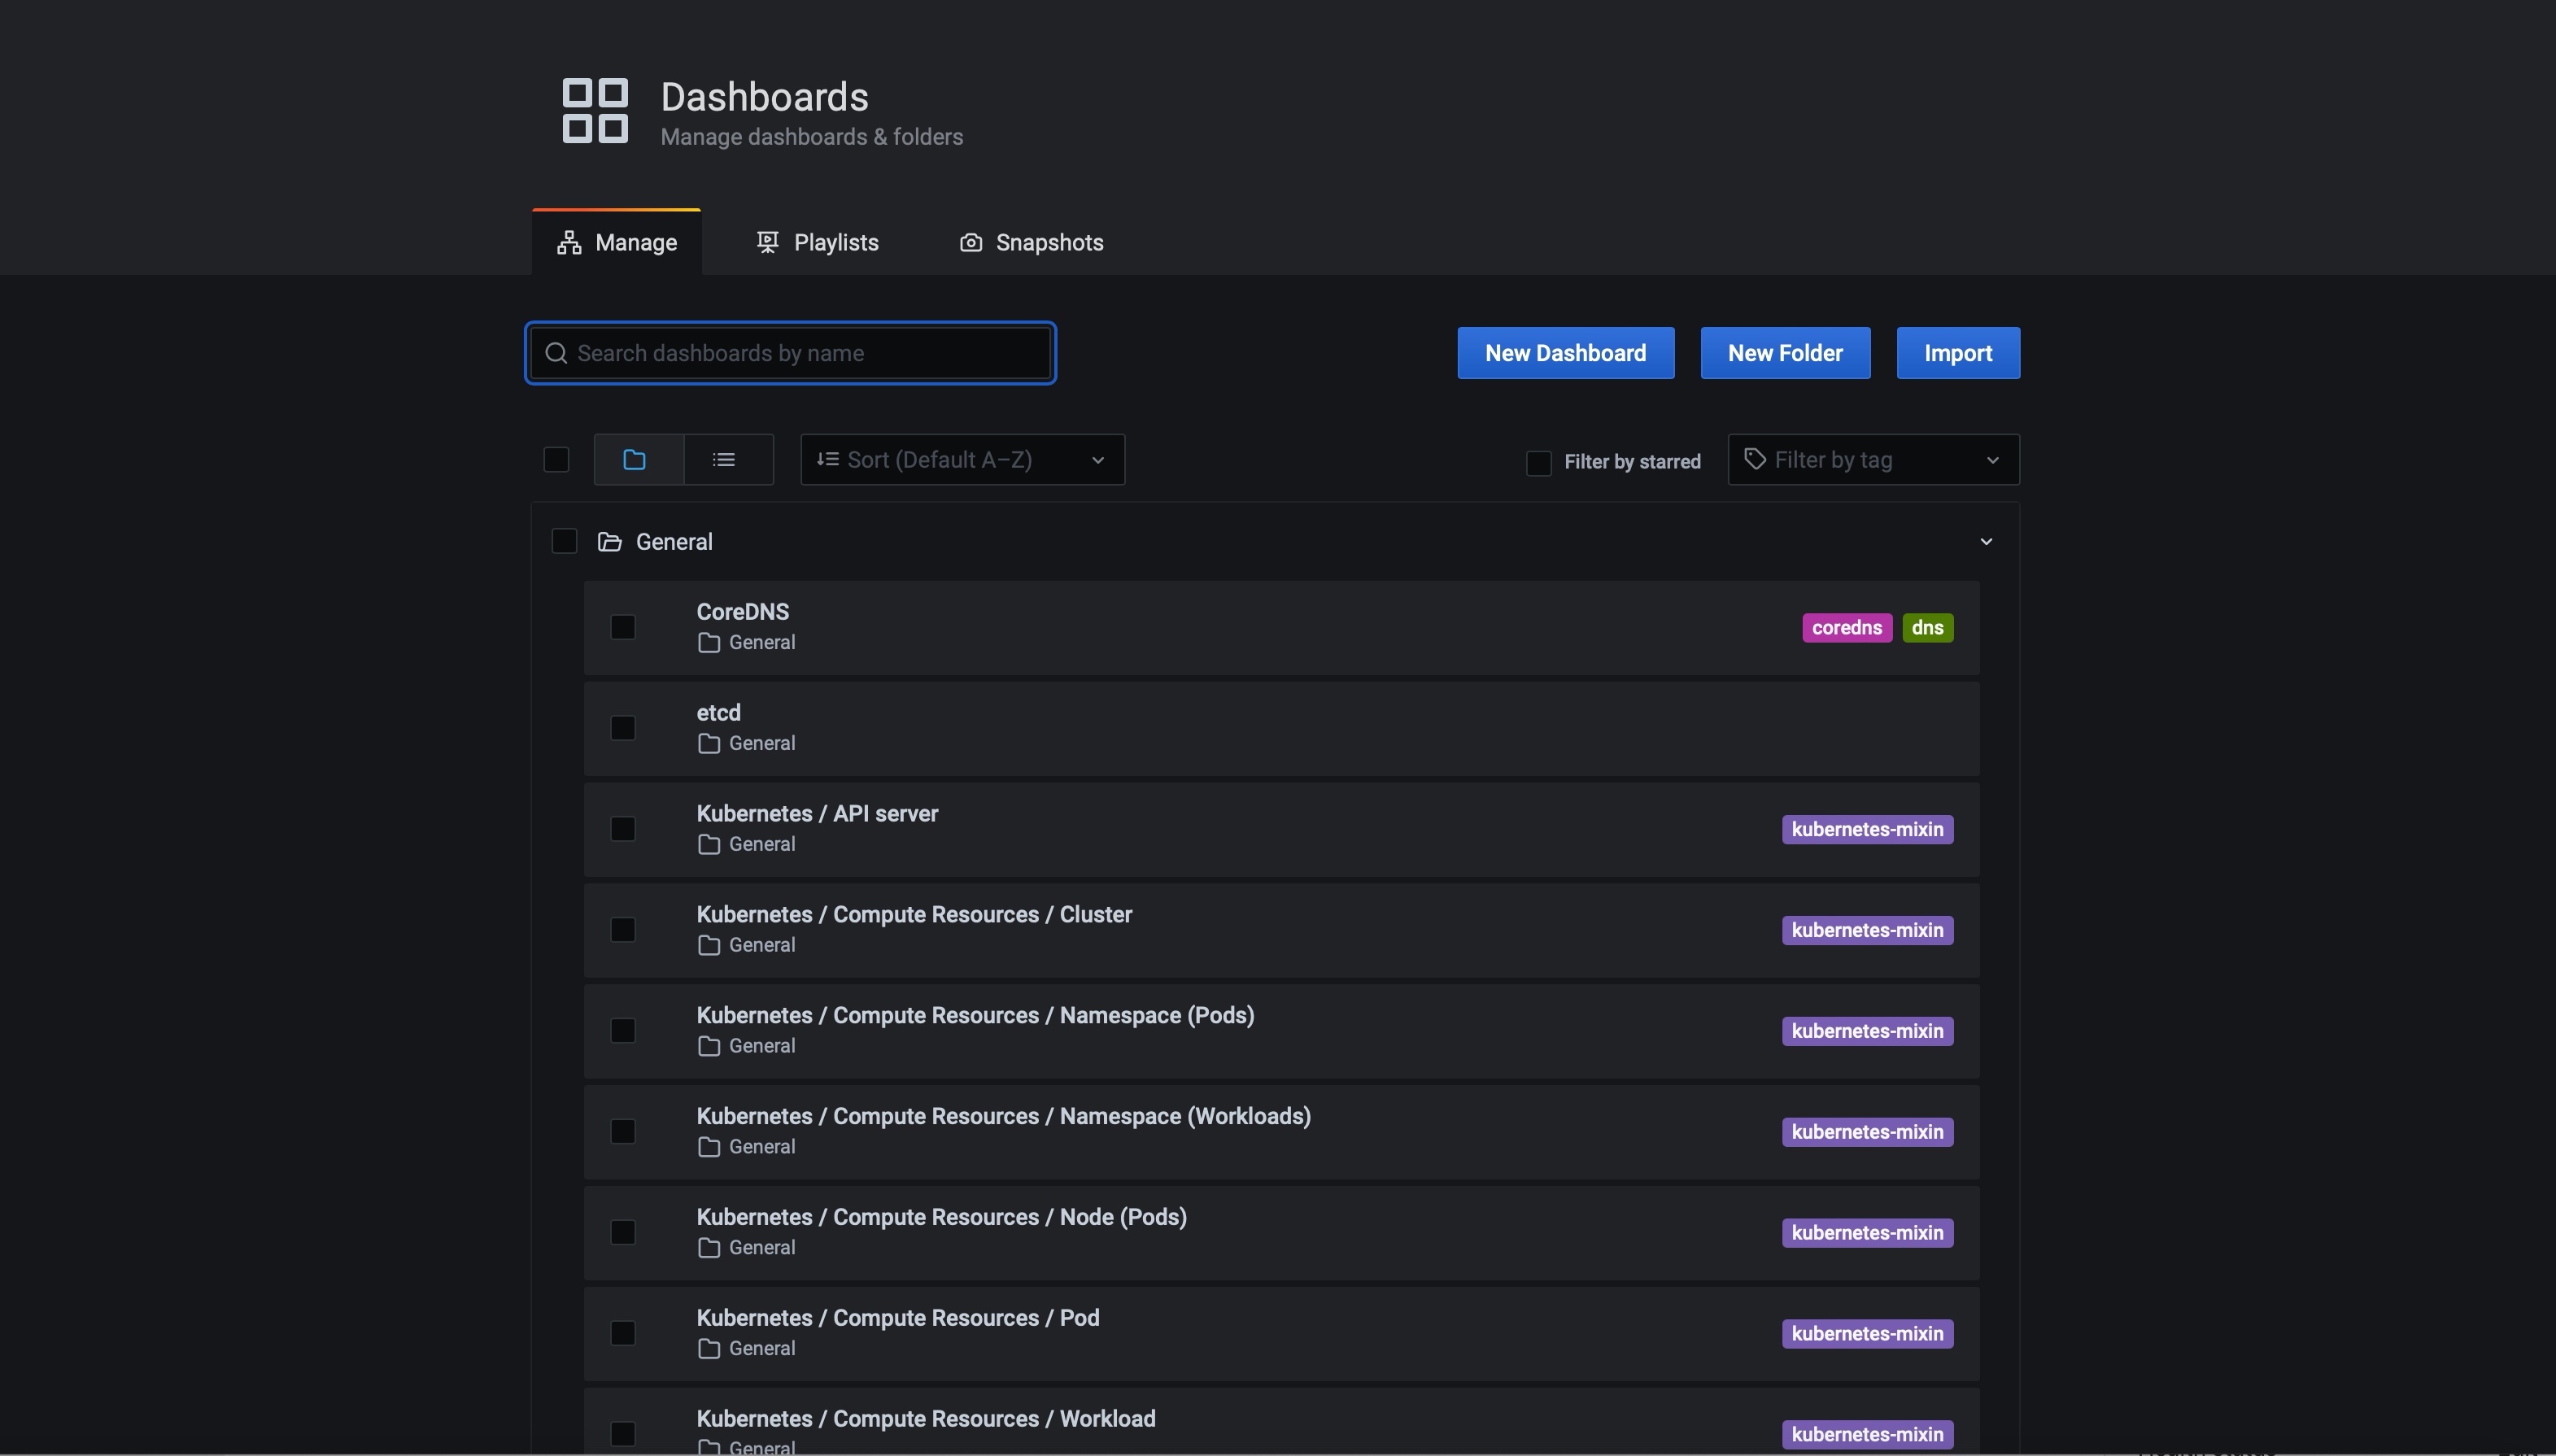
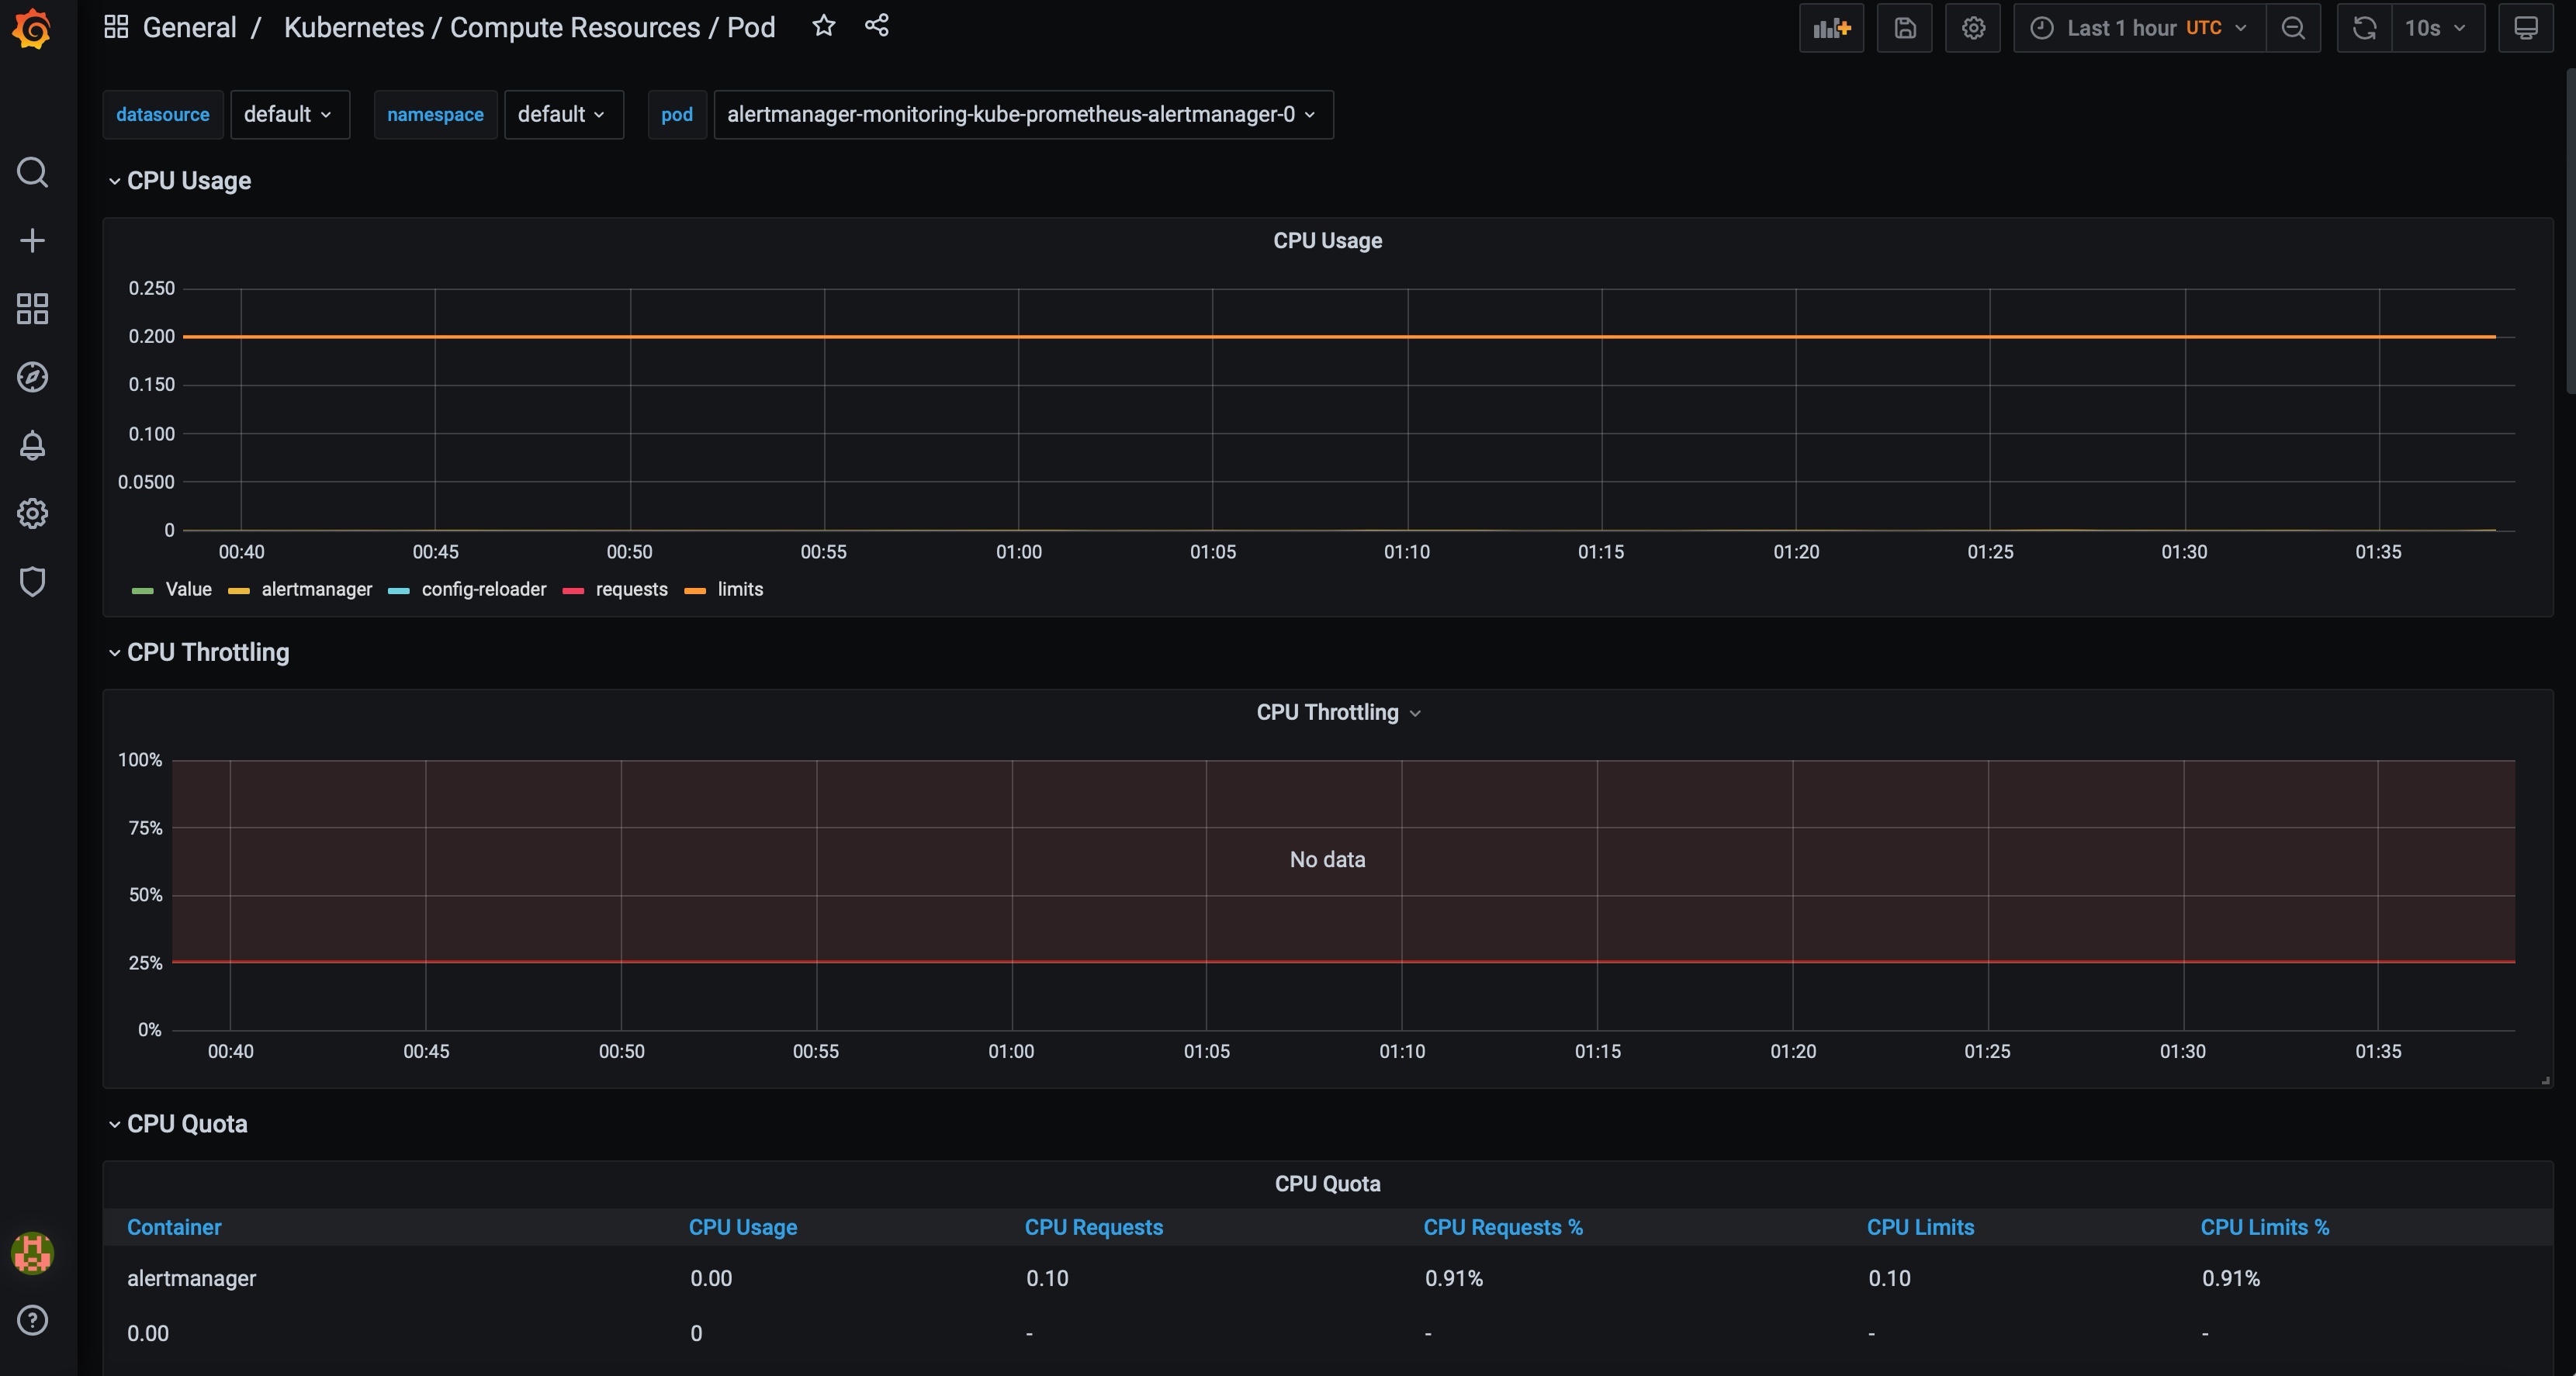
1. From the Dashboard select Kubernetes/Compute Resource / Pod . \
This creates a dashboard to monitor the pod resource CPU Usage, CPU Throttling, CPU quota, Memory Usage, Memory Quota, etc. \